Great Cormorant
Phalacrocorax carbo
ABR description
The following is extracted from the Annual Bird Report for the twelve months to June 2017.
Common, breeding resident
Commonly found on the urban lakes and wetlands.
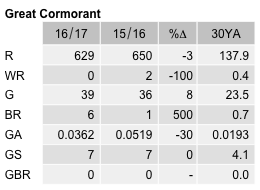
General: As with all the cormorants, the number of records and reporting rate of the Great Cormorant have soared over the last 30 years, with the new urban wetlands a major contributing factor. Recorded in 49 weeks of the year, with fewer autumn (7%) and winter records (17%), followed by more spring records than usual (40%), and 36% in summer. Max 15/17 Dec Gungahlin Pond (RoM1); average 2.4, median 1. From 40 widespread grid cells. 6 breeding records from 3 sites, from on/29 Oct to ny/11 Mar QSP (BuM1). Other breeding sites were Gungahlin Pond and Gigerline.
GBS: 50 records, at a reporting rate of 1.9% as against the 30YA of 0.7%. Recorded in 33 weeks. Range 1-7 birds. From 7 sites, LBG, Curtin, Jerrabomberra, Giralang, Ainslie and Gleneagles.
Abundance
Abundance is the average number of birds of that species per survey. Where the species was observed (presence recorded) but the number of birds seen was not recorded, this is treated as a count of zero.
Abundance by year
This chart shows the abundance of Great Cormorant between 1982 and 2017. 
Abundance by month
This chart shows the monthly abundance of Great Cormorant. The blue lines show the abundance for the twelve months to June 2017 and the bars show the average abundance for the period 1982 to 2017. 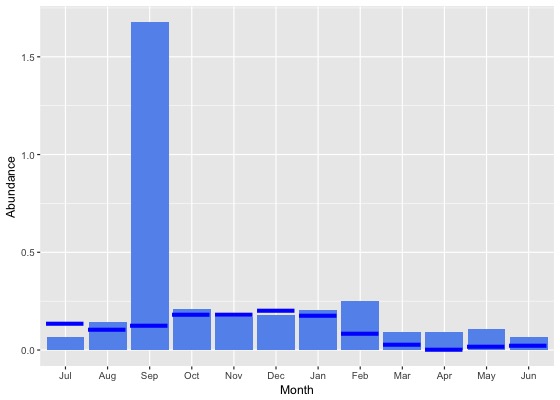
Abundance by season
This chart shows the seasonal abundance of Great Cormorant. The blue lines show the seasonal abundance for the twelve months to June 2017 and the bars show the average seasonal abundance for the period 1982 to 2017. 
Abundance data
| Month | Season | ||||||||||||||||||
|---|---|---|---|---|---|---|---|---|---|---|---|---|---|---|---|---|---|---|---|
| Period | Jul | Aug | Sep | Oct | Nov | Dec | Jan | Feb | Mar | Apr | May | Jun | Winter | Spring | Summer | Autumn | All | ||
| All years | |||||||||||||||||||
| All | 0.1 | 0.1 | 1.7 | 0.2 | 0.2 | 0.2 | 0.2 | 0.3 | 0.1 | 0.1 | 0.1 | 0.1 | 0.1 | 0.7 | 0.2 | 0.1 | 0.3 | ||
| Previous years | |||||||||||||||||||
| All previous years | 0.1 | 0.1 | 1.9 | 0.2 | 0.2 | 0.2 | 0.2 | 0.3 | 0.1 | 0.1 | 0.1 | 0.1 | 0.1 | 0.7 | 0.2 | 0.1 | 0.3 | ||
| Previous 30 years | 0.1 | 0.1 | 1.9 | 0.2 | 0.1 | 0.1 | 0.2 | 0.2 | 0.1 | 0.1 | 0.1 | 0.1 | 0.1 | 0.7 | 0.2 | 0.1 | 0.3 | ||
| Previous 20 years | 0.1 | 0.1 | 0.1 | 0.2 | 0.1 | 0.1 | 0.2 | 0.2 | 0.1 | 0.1 | 0.1 | 0.1 | 0.1 | 0.1 | 0.2 | 0.1 | 0.1 | ||
| 10 year groups | |||||||||||||||||||
| [2007,2017) | 0.1 | 0.1 | 0.1 | 0.2 | 0.2 | 0.1 | 0.2 | 0.3 | 0.1 | 0.1 | 0.1 | 0.0 | 0.1 | 0.2 | 0.2 | 0.1 | 0.1 | ||
| [1997,2007) | 0.0 | 0.0 | 0.1 | 0.1 | 0.0 | 0.0 | 0.1 | 0.1 | 0.1 | 0.0 | 0.2 | 0.1 | 0.0 | 0.1 | 0.1 | 0.1 | 0.1 | ||
| [1987,1997) | 0.1 | 0.1 | 11.2 | 0.4 | 0.1 | 0.3 | 0.2 | 0.3 | 0.1 | 0.2 | 0.1 | 0.1 | 0.1 | 3.4 | 0.3 | 0.1 | 1.1 | ||
| 5 year groups | |||||||||||||||||||
| [2012,2017) | 0.1 | 0.1 | 0.2 | 0.2 | 0.2 | 0.1 | 0.2 | 0.3 | 0.1 | 0.1 | 0.1 | 0.1 | 0.1 | 0.2 | 0.2 | 0.1 | 0.2 | ||
| [2007,2012) | 0.0 | 0.1 | 0.1 | 0.2 | 0.2 | 0.2 | 0.3 | 0.2 | 0.1 | 0.1 | 0.0 | 0.0 | 0.0 | 0.2 | 0.2 | 0.1 | 0.1 | ||
| [2002,2007) | 0.0 | 0.0 | 0.1 | 0.1 | 0.0 | 0.0 | 0.1 | 0.1 | 0.1 | 0.1 | 0.4 | 0.1 | 0.1 | 0.1 | 0.1 | 0.2 | 0.1 | ||
| [1997,2002) | 0.0 | 0.1 | 0.1 | 0.1 | 0.0 | 0.0 | 0.1 | 0.1 | 0.0 | 0.0 | 0.0 | 0.0 | 0.0 | 0.1 | 0.1 | 0.0 | 0.0 | ||
| [1992,1997) | 0.1 | 0.1 | 0.2 | 0.3 | 0.3 | 0.2 | 0.4 | 0.2 | 0.1 | 0.1 | 0.0 | 0.1 | 0.1 | 0.3 | 0.3 | 0.1 | 0.2 | ||
| [1987,1992) | 0.0 | 0.1 | 16.4 | 0.4 | 0.1 | 0.4 | 0.1 | 0.3 | 0.1 | 0.2 | 0.1 | 0.1 | 0.1 | 5.0 | 0.3 | 0.1 | 1.6 | ||
| Year | |||||||||||||||||||
| 2017 | 0.1 | 0.1 | 0.1 | 0.2 | 0.2 | 0.2 | 0.2 | 0.1 | 0.0 | 0.0 | 0.0 | 0.0 | 0.1 | 0.2 | 0.2 | 0.0 | 0.1 | ||
| 2016 | 0.1 | 0.1 | 0.1 | 0.2 | 0.2 | 0.1 | 0.2 | 0.3 | 0.1 | 0.1 | 0.1 | 0.0 | 0.1 | 0.2 | 0.2 | 0.1 | 0.2 | ||
| 2015 | 0.1 | 0.2 | 0.2 | 0.2 | 0.2 | 0.1 | 0.2 | 0.3 | 0.1 | 0.1 | 0.2 | 0.1 | 0.1 | 0.2 | 0.2 | 0.1 | 0.2 | ||
| 2014 | 0.2 | 0.1 | 0.1 | 0.1 | 0.1 | 0.1 | 0.3 | 0.3 | 0.2 | 0.2 | 0.1 | 0.1 | 0.1 | 0.1 | 0.2 | 0.2 | 0.2 | ||
| 2013 | 0.1 | 0.3 | 0.1 | 0.2 | 0.2 | 0.1 | 0.4 | 0.2 | 0.2 | 0.1 | 0.1 | 0.1 | 0.1 | 0.2 | 0.2 | 0.1 | 0.2 | ||
| 2012 | 0.0 | 0.0 | 0.1 | 0.1 | 0.2 | 0.2 | 0.2 | 0.2 | 0.0 | 0.1 | 0.0 | 0.0 | 0.0 | 0.1 | 0.2 | 0.1 | 0.1 | ||
| 2011 | 0.0 | 0.0 | 0.1 | 0.1 | 0.3 | 0.0 | 0.2 | 0.1 | 0.1 | 0.0 | 0.0 | 0.0 | 0.0 | 0.2 | 0.1 | 0.0 | 0.1 | ||
| 2010 | 0.0 | 0.1 | 0.1 | 0.1 | 0.0 | 0.2 | 0.1 | 0.2 | 0.2 | 0.0 | 0.1 | 0.0 | 0.0 | 0.1 | 0.1 | 0.1 | 0.1 | ||
| 2009 | 0.1 | 0.3 | 0.2 | 0.2 | 0.3 | 0.0 | 0.4 | 0.3 | 0.2 | 0.1 | 0.1 | 0.0 | 0.1 | 0.2 | 0.2 | 0.1 | 0.2 | ||
| 2008 | 0.0 | 0.1 | 0.1 | 0.1 | 0.1 | 0.0 | 0.3 | 0.5 | 0.1 | 0.0 | 0.0 | 0.0 | 0.0 | 0.1 | 0.2 | 0.0 | 0.1 | ||
| 2007 | 0.1 | 0.1 | 0.0 | 0.3 | 0.4 | 0.5 | 0.3 | 0.2 | 0.1 | 0.1 | 0.0 | 0.0 | 0.0 | 0.2 | 0.4 | 0.1 | 0.2 | ||
| 2006 | 0.0 | 0.0 | 0.1 | 0.1 | 0.1 | 0.0 | 0.3 | 0.1 | 0.1 | 0.2 | 0.1 | 0.2 | 0.1 | 0.1 | 0.2 | 0.1 | 0.1 | ||
| 2005 | 0.1 | 0.1 | 0.1 | 0.1 | 0.1 | 0.0 | 0.1 | 0.2 | 0.3 | 0.0 | 1.0 | 0.2 | 0.1 | 0.1 | 0.1 | 0.4 | 0.2 | ||
| 2004 | 0.0 | 0.0 | 0.0 | 0.1 | 0.0 | 0.0 | 0.0 | 0.2 | 0.0 | 0.0 | 0.2 | 0.1 | 0.0 | 0.0 | 0.1 | 0.0 | 0.0 | ||
| 2003 | 0.0 | 0.0 | 0.0 | 0.0 | 0.1 | 0.0 | 0.0 | 0.0 | 0.1 | 0.1 | 0.0 | 0.0 | 0.0 | 0.0 | 0.0 | 0.1 | 0.0 | ||
| 2002 | 0.0 | 0.0 | 0.0 | 0.1 | 0.0 | 0.1 | 0.1 | 0.1 | 0.0 | 0.0 | 0.0 | 0.0 | 0.0 | 0.0 | 0.1 | 0.0 | 0.0 | ||
| 2001 | 0.0 | 0.0 | 0.0 | 0.1 | 0.1 | 0.0 | 0.0 | 0.0 | 0.0 | 0.0 | 0.0 | 0.0 | 0.0 | 0.0 | 0.0 | 0.0 | 0.0 | ||
| 2000 | 0.0 | 0.1 | 0.0 | 0.1 | 0.0 | 0.0 | 0.1 | 0.1 | 0.0 | 0.0 | 0.0 | 0.0 | 0.0 | 0.1 | 0.1 | 0.0 | 0.0 | ||
| 1999 | 0.0 | 0.1 | 0.0 | 0.1 | 0.0 | 0.0 | 0.0 | 0.1 | 0.0 | 0.0 | 0.0 | 0.0 | 0.0 | 0.0 | 0.1 | 0.0 | 0.0 | ||
| 1998 | 0.0 | 0.0 | 0.2 | 0.2 | 0.0 | 0.1 | 0.1 | 0.0 | 0.0 | 0.0 | 0.0 | 0.0 | 0.0 | 0.1 | 0.1 | 0.0 | 0.1 | ||
| 1997 | 0.0 | 0.1 | 0.1 | 0.4 | 0.1 | 0.0 | 0.1 | 0.2 | 0.0 | 0.0 | 0.0 | 0.0 | 0.0 | 0.1 | 0.1 | 0.0 | 0.1 | ||
| 1996 | 0.0 | 0.1 | 0.0 | 0.1 | 0.0 | 0.4 | 0.6 | 0.1 | 0.0 | 0.1 | 0.0 | 0.0 | 0.0 | 0.0 | 0.4 | 0.1 | 0.1 | ||
| 1995 | 0.1 | 0.2 | 0.0 | 0.6 | 0.1 | 0.1 | 0.1 | 0.1 | 0.2 | 0.1 | 0.0 | 0.0 | 0.1 | 0.3 | 0.1 | 0.1 | 0.2 | ||
| 1994 | 0.0 | 0.0 | 0.1 | 0.1 | 0.2 | 0.1 | 0.1 | 0.0 | 0.2 | 0.2 | 0.0 | 0.4 | 0.2 | 0.1 | 0.1 | 0.1 | 0.1 | ||
| 1993 | 0.1 | 0.1 | 0.0 | 0.4 | 0.6 | 0.0 | 0.5 | 0.2 | 0.1 | 0.1 | 0.0 | 0.0 | 0.1 | 0.4 | 0.3 | 0.1 | 0.2 | ||
| 1992 | 0.2 | 0.0 | 0.8 | 0.4 | 0.9 | 0.2 | 0.7 | 0.5 | 0.2 | 0.2 | 0.1 | 0.1 | 0.1 | 0.7 | 0.4 | 0.1 | 0.4 | ||
| 1991 | 0.0 | 0.1 | 0.7 | 0.3 | 0.2 | 0.6 | 0.6 | 1.0 | 0.1 | 0.0 | 0.5 | 0.0 | 0.0 | 0.4 | 0.7 | 0.2 | 0.3 | ||
| 1990 | 0.0 | 0.0 | 0.1 | 0.5 | 0.0 | 0.1 | 0.1 | 0.2 | 0.2 | 0.4 | 0.1 | 0.1 | 0.0 | 0.2 | 0.2 | 0.2 | 0.1 | ||
| 1989 | 0.1 | 0.2 | 0.1 | 0.3 | 0.1 | 0.3 | 0.0 | 0.2 | 0.1 | 0.2 | 0.0 | 0.1 | 0.1 | 0.2 | 0.2 | 0.1 | 0.1 | ||
| 1988 | 0.1 | 0.1 | 0.1 | 0.3 | 0.0 | 0.5 | 0.1 | 0.4 | 0.1 | 0.2 | 0.1 | 0.1 | 0.1 | 0.2 | 0.3 | 0.1 | 0.2 | ||
| 1987 | 0.0 | 0.5 | 55.0 | 0.4 | 0.1 | 0.4 | 0.1 | 0.3 | 0.1 | 0.1 | 0.1 | 0.1 | 0.1 | 16.4 | 0.2 | 0.1 | 5.8 | ||
| 1986 | 0.1 | 1.7 | 0.3 | 2.0 | 0.3 | 1.3 | 0.4 | 1.8 | 0.4 | 1.2 | 0.7 | 0.6 | 0.9 | 0.7 | 1.3 | 0.8 | 0.9 | ||
| 1985 | 0.0 | 1.3 | 0.3 | 0.9 | 0.4 | 0.6 | 0.5 | 0.6 | 0.0 | 0.5 | 0.1 | 0.9 | 0.7 | 0.6 | 0.6 | 0.3 | 0.6 | ||
| 1984 | 0.0 | 5.7 | 0.2 | 8.4 | 0.2 | 4.2 | 0.1 | 1.3 | 0.0 | 0.0 | 0.0 | 0.0 | 1.2 | 4.9 | 1.3 | 0.0 | 1.1 | ||
| 1983 | 0.2 | 2.8 | 0.0 | 9.9 | 0.7 | 7.6 | 0.3 | 11.5 | 0.0 | - | 3.2 | 1.0 | 1.6 | 5.0 | 7.6 | 2.8 | 4.5 | ||
| 1982 | - | 2.6 | - | 0.0 | 13.8 | 6.8 | - | 7.5 | - | 2.0 | - | 2.4 | 2.5 | 12.2 | 7.1 | 2.0 | 5.2 | ||
Reporting rates
Reporting rate is the proportion of all surveys in which the species was present.
Reporting rate by year
This chart shows the reporting rate of Great Cormorant each year between 1982 and 2017. 
Reporting rate by month
This chart shows the reporting rate by month of Great Cormorant. The blue lines show the reporting rate for the twelve months to June 2017 and the bars show the average reporting rate for the period 1982 to 2017. 
Reporting rate by season
This chart shows the seasonal reporting rate of Great Cormorant. The blue lines show the seasonal reporting rate for the twelve months to June 2017 and the bars show the average seasonal reporting rate for the period 1982 to 2017. 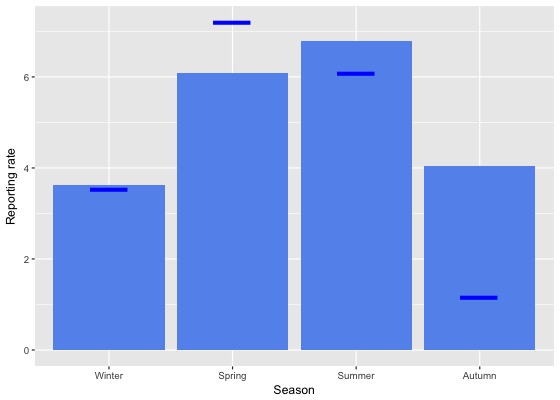
Reporting rate data
| Month | Season | ||||||||||||||||||
|---|---|---|---|---|---|---|---|---|---|---|---|---|---|---|---|---|---|---|---|
| Period | Jul | Aug | Sep | Oct | Nov | Dec | Jan | Feb | Mar | Apr | May | Jun | Winter | Spring | Summer | Autumn | All | ||
| All years | |||||||||||||||||||
| All | 3.5 | 5.3 | 5.0 | 6.6 | 6.5 | 5.7 | 7.3 | 7.6 | 4.0 | 4.1 | 4.1 | 2.5 | 3.6 | 6.1 | 6.8 | 4.0 | 5.3 | ||
| Previous years | |||||||||||||||||||
| All previous years | 3.1 | 5.2 | 4.9 | 6.6 | 6.2 | 5.3 | 7.4 | 8.4 | 4.4 | 4.6 | 4.8 | 2.8 | 3.6 | 5.9 | 6.9 | 4.6 | 5.4 | ||
| Previous 30 years | 3.1 | 4.5 | 4.7 | 6.2 | 5.8 | 4.8 | 7.4 | 7.7 | 4.4 | 4.3 | 4.5 | 2.5 | 3.3 | 5.6 | 6.5 | 4.4 | 5.1 | ||
| Previous 20 years | 2.7 | 4.1 | 4.2 | 5.6 | 5.3 | 3.9 | 7.4 | 7.2 | 4.0 | 3.6 | 4.5 | 2.0 | 2.8 | 5.1 | 6.1 | 4.0 | 4.6 | ||
| 10 year groups | |||||||||||||||||||
| [2007,2017) | 3.8 | 5.0 | 4.9 | 5.5 | 6.3 | 4.6 | 8.3 | 8.1 | 4.8 | 4.1 | 4.7 | 2.5 | 3.6 | 5.5 | 7.0 | 4.5 | 5.3 | ||
| [1997,2007) | 0.8 | 2.3 | 2.8 | 5.9 | 3.3 | 2.7 | 4.6 | 4.9 | 2.3 | 2.2 | 4.0 | 0.9 | 1.2 | 4.0 | 3.9 | 2.6 | 3.0 | ||
| [1987,1997) | 4.4 | 5.5 | 7.1 | 10.2 | 7.4 | 9.5 | 6.9 | 9.8 | 6.2 | 7.7 | 4.5 | 5.2 | 5.0 | 8.3 | 8.7 | 6.2 | 7.1 | ||
| 5 year groups | |||||||||||||||||||
| [2012,2017) | 4.5 | 5.4 | 5.5 | 6.0 | 6.5 | 5.3 | 8.2 | 8.0 | 5.4 | 5.0 | 5.4 | 3.1 | 4.2 | 6.0 | 7.3 | 5.2 | 5.8 | ||
| [2007,2012) | 2.0 | 3.4 | 3.5 | 4.7 | 5.9 | 3.2 | 8.4 | 8.5 | 3.3 | 2.1 | 2.7 | 1.3 | 1.9 | 4.6 | 6.1 | 2.7 | 4.0 | ||
| [2002,2007) | 0.8 | 1.9 | 3.0 | 6.1 | 3.1 | 3.3 | 4.9 | 5.9 | 3.0 | 3.4 | 6.2 | 1.4 | 1.3 | 4.1 | 4.4 | 3.9 | 3.5 | ||
| [1997,2002) | 0.8 | 2.7 | 2.6 | 5.6 | 3.6 | 2.0 | 4.3 | 4.0 | 1.3 | 0.6 | 1.1 | 0.3 | 1.1 | 3.8 | 3.3 | 1.0 | 2.4 | ||
| [1992,1997) | 4.3 | 3.0 | 5.1 | 6.8 | 7.9 | 5.6 | 6.9 | 8.6 | 5.5 | 5.0 | 2.2 | 2.5 | 3.2 | 6.7 | 6.9 | 4.3 | 5.3 | ||
| [1987,1992) | 4.4 | 6.8 | 8.0 | 12.0 | 7.1 | 11.3 | 6.9 | 10.3 | 6.6 | 9.2 | 5.8 | 6.7 | 6.0 | 9.1 | 9.5 | 7.2 | 8.0 | ||
| Year | |||||||||||||||||||
| 2017 | 5.6 | 5.5 | 6.4 | 6.9 | 8.4 | 7.9 | 6.6 | 3.9 | 1.7 | 0.7 | 1.0 | 1.0 | 3.5 | 7.2 | 6.1 | 1.2 | 4.5 | ||
| 2016 | 3.8 | 5.3 | 5.1 | 6.5 | 6.9 | 4.5 | 6.3 | 8.1 | 5.4 | 4.3 | 6.0 | 3.0 | 4.1 | 6.2 | 6.4 | 5.2 | 5.6 | ||
| 2015 | 6.5 | 5.8 | 7.5 | 6.8 | 6.4 | 4.6 | 6.4 | 6.2 | 5.2 | 4.6 | 6.2 | 2.3 | 4.4 | 6.9 | 5.8 | 5.3 | 5.7 | ||
| 2014 | 7.3 | 7.6 | 5.2 | 5.0 | 4.1 | 4.9 | 10.1 | 9.4 | 7.3 | 8.2 | 6.6 | 6.0 | 6.7 | 4.9 | 8.9 | 7.4 | 7.0 | ||
| 2013 | 3.6 | 8.6 | 6.5 | 6.5 | 7.7 | 5.5 | 12.3 | 7.6 | 5.3 | 4.9 | 4.2 | 4.3 | 5.4 | 6.8 | 8.5 | 4.9 | 6.7 | ||
| 2012 | 1.6 | 0.4 | 2.2 | 4.2 | 6.0 | 8.1 | 9.2 | 10.7 | 3.0 | 4.7 | 0.0 | 0.9 | 1.0 | 4.1 | 9.1 | 3.0 | 4.6 | ||
| 2011 | 1.6 | 0.0 | 3.1 | 4.0 | 5.5 | 5.1 | 9.2 | 11.0 | 2.5 | 0.9 | 1.8 | 0.9 | 0.8 | 4.0 | 8.1 | 1.8 | 3.9 | ||
| 2010 | 0.0 | 2.6 | 4.5 | 5.1 | 3.3 | 3.3 | 4.8 | 7.1 | 2.8 | 1.3 | 2.0 | 0.4 | 0.8 | 4.5 | 4.4 | 2.0 | 3.3 | ||
| 2009 | 1.4 | 7.3 | 3.0 | 4.4 | 7.6 | 3.7 | 8.7 | 5.8 | 4.2 | 3.7 | 6.9 | 2.3 | 3.1 | 4.7 | 5.9 | 4.6 | 4.6 | ||
| 2008 | 2.1 | 5.2 | 4.5 | 3.8 | 5.4 | 2.3 | 10.3 | 9.3 | 2.2 | 0.6 | 0.9 | 0.9 | 2.3 | 4.2 | 6.1 | 1.1 | 3.5 | ||
| 2007 | 5.5 | 2.8 | 2.1 | 6.3 | 8.1 | 1.3 | 9.1 | 7.0 | 5.1 | 5.1 | 2.4 | 2.0 | 2.8 | 5.4 | 5.2 | 4.6 | 4.7 | ||
| 2006 | 1.3 | 1.0 | 2.2 | 5.4 | 4.2 | 3.9 | 10.7 | 6.7 | 4.1 | 6.5 | 8.0 | 1.1 | 1.2 | 4.2 | 7.1 | 5.6 | 4.5 | ||
| 2005 | 0.7 | 1.9 | 2.2 | 6.6 | 3.4 | 1.2 | 4.3 | 8.7 | 4.3 | 2.2 | 10.4 | 1.9 | 1.6 | 3.9 | 3.5 | 5.7 | 3.8 | ||
| 2004 | 1.2 | 2.6 | 3.8 | 7.0 | 1.7 | 1.8 | 2.4 | 6.1 | 1.6 | 1.6 | 4.9 | 1.8 | 1.8 | 4.2 | 2.9 | 2.3 | 2.8 | ||
| 2003 | 0.9 | 1.4 | 4.2 | 4.7 | 3.2 | 0.4 | 2.2 | 3.8 | 1.3 | 5.5 | 0.8 | 0.6 | 1.0 | 4.0 | 2.0 | 2.8 | 2.6 | ||
| 2002 | 0.0 | 2.5 | 2.5 | 7.3 | 3.0 | 7.4 | 3.8 | 5.9 | 2.7 | 0.6 | 3.5 | 1.1 | 1.0 | 4.4 | 6.2 | 2.1 | 3.7 | ||
| 2001 | 0.4 | 1.8 | 1.2 | 3.8 | 4.5 | 1.1 | 3.0 | 4.1 | 0.9 | 1.5 | 1.2 | 0.0 | 0.7 | 2.8 | 2.5 | 1.1 | 1.8 | ||
| 2000 | 1.6 | 2.6 | 2.8 | 6.2 | 3.7 | 2.3 | 5.4 | 6.2 | 2.9 | 0.4 | 1.8 | 0.5 | 1.5 | 4.3 | 4.4 | 1.7 | 3.2 | ||
| 1999 | 0.0 | 5.2 | 2.9 | 4.4 | 2.6 | 1.9 | 2.2 | 1.4 | 0.5 | 0.0 | 0.6 | 0.5 | 1.7 | 3.3 | 1.8 | 0.4 | 1.8 | ||
| 1998 | 2.7 | 0.0 | 4.1 | 7.6 | 4.4 | 4.7 | 7.4 | 0.0 | 1.1 | 2.6 | 3.7 | 0.0 | 0.6 | 5.2 | 4.4 | 1.9 | 3.5 | ||
| 1997 | 0.0 | 3.4 | 4.5 | 9.2 | 2.6 | 1.0 | 5.9 | 5.3 | 0.0 | 0.0 | 0.0 | 0.0 | 0.9 | 5.0 | 3.3 | 0.0 | 2.6 | ||
| 1996 | 4.5 | 4.3 | 1.3 | 1.8 | 0.9 | 6.1 | 8.7 | 4.7 | 2.9 | 3.1 | 1.7 | 0.0 | 2.8 | 1.3 | 6.6 | 2.7 | 3.4 | ||
| 1995 | 5.4 | 4.7 | 1.0 | 9.1 | 3.6 | 3.4 | 2.7 | 6.3 | 8.2 | 4.8 | 0.0 | 1.1 | 3.8 | 5.3 | 3.8 | 4.7 | 4.5 | ||
| 1994 | 2.0 | 1.3 | 5.9 | 7.0 | 4.4 | 6.5 | 4.4 | 1.7 | 5.7 | 4.6 | 3.8 | 3.4 | 2.3 | 5.5 | 4.1 | 4.7 | 4.3 | ||
| 1993 | 6.1 | 2.6 | 1.6 | 9.3 | 18.2 | 2.2 | 10.2 | 15.6 | 2.5 | 3.3 | 0.0 | 2.9 | 3.6 | 9.9 | 8.7 | 1.8 | 5.6 | ||
| 1992 | 3.1 | 0.0 | 15.3 | 6.4 | 22.2 | 9.5 | 12.1 | 24.4 | 8.5 | 10.2 | 5.3 | 6.7 | 3.4 | 13.9 | 14.2 | 7.8 | 10.0 | ||
| 1991 | 0.8 | 4.3 | 7.0 | 6.8 | 10.3 | 9.5 | 8.9 | 6.0 | 4.8 | 1.7 | 9.8 | 2.0 | 2.2 | 8.0 | 8.3 | 5.5 | 5.9 | ||
| 1990 | 2.6 | 3.8 | 9.7 | 10.2 | 4.7 | 8.3 | 6.9 | 11.3 | 4.5 | 9.5 | 6.8 | 5.3 | 3.6 | 8.1 | 8.8 | 6.9 | 6.4 | ||
| 1989 | 6.1 | 8.2 | 8.7 | 11.5 | 7.6 | 9.6 | 4.3 | 9.3 | 5.6 | 9.7 | 3.9 | 6.0 | 6.9 | 9.5 | 7.8 | 6.6 | 7.8 | ||
| 1988 | 5.6 | 7.5 | 8.4 | 12.1 | 4.8 | 10.8 | 7.0 | 11.4 | 6.9 | 12.3 | 6.1 | 6.8 | 6.6 | 8.3 | 9.7 | 8.3 | 8.2 | ||
| 1987 | 18.2 | 26.7 | 6.9 | 15.2 | 8.7 | 15.2 | 8.7 | 10.8 | 8.6 | 8.2 | 5.2 | 8.8 | 10.4 | 10.1 | 11.6 | 7.3 | 9.8 | ||
| 1986 | 11.5 | 36.8 | 28.3 | 30.6 | 23.4 | 41.2 | 21.7 | 44.4 | 22.6 | 45.1 | 44.8 | 17.1 | 23.2 | 27.2 | 37.6 | 38.7 | 31.4 | ||
| 1985 | 0.0 | 23.3 | 7.7 | 17.4 | 14.0 | 11.7 | 25.0 | 11.8 | 0.0 | 15.8 | 10.0 | 28.6 | 17.0 | 13.8 | 12.9 | 10.0 | 14.0 | ||
| 1984 | 0.0 | 60.0 | 20.0 | 83.3 | 25.0 | 66.7 | 3.4 | 42.4 | 0.0 | 0.0 | 0.0 | 0.0 | 12.2 | 57.1 | 31.1 | 0.0 | 17.4 | ||
| 1983 | 16.7 | 75.0 | 0.0 | 53.8 | 44.4 | 69.2 | 16.7 | 81.8 | 0.0 | - | 41.7 | 36.4 | 48.3 | 40.7 | 63.3 | 35.7 | 49.0 | ||
| 1982 | - | 63.6 | - | 0.0 | 87.5 | 64.3 | - | 72.7 | - | 46.2 | - | 42.9 | 52.0 | 77.8 | 68.0 | 46.2 | 59.7 | ||
Breeding data
Breeding records by month
Number of breeding records by breeding code and month, 2017 and all years| Breeding code | Jul | Aug | Sep | Oct | Nov | Dec | Jan | Feb | Mar | Apr | May | Jun |
|---|---|---|---|---|---|---|---|---|---|---|---|---|
| 2017 | ||||||||||||
| Breeding (BLA code) | 0 | 0 | 0 | 0 | 0 | 0 | 0 | 0 | 0 | 0 | 0 | 0 |
| Carrying Food | 0 | 0 | 0 | 0 | 0 | 0 | 0 | 0 | 0 | 0 | 0 | 0 |
| Copulating | 0 | 0 | 0 | 0 | 0 | 0 | 0 | 0 | 0 | 0 | 0 | 0 |
| Display | 0 | 0 | 0 | 0 | 0 | 0 | 0 | 0 | 0 | 0 | 0 | 0 |
| Dependent young | 0 | 0 | 0 | 0 | 0 | 0 | 0 | 1 | 0 | 0 | 0 | 0 |
| Faecal sac | 0 | 0 | 0 | 0 | 0 | 0 | 0 | 0 | 0 | 0 | 0 | 0 |
| Inspecting hollow | 0 | 0 | 0 | 0 | 0 | 0 | 0 | 0 | 0 | 0 | 0 | 0 |
| Nest building | 0 | 0 | 0 | 0 | 1 | 0 | 0 | 0 | 0 | 0 | 0 | 0 |
| Nest with eggs | 0 | 0 | 0 | 0 | 0 | 0 | 0 | 0 | 0 | 0 | 0 | 0 |
| Nest with young | 0 | 0 | 0 | 0 | 0 | 0 | 0 | 0 | 1 | 0 | 0 | 0 |
| On/leaving nest | 0 | 0 | 0 | 1 | 1 | 1 | 0 | 0 | 0 | 0 | 0 | 0 |
| All years | ||||||||||||
| Breeding (BLA code) | 0 | 0 | 0 | 0 | 1 | 1 | 0 | 0 | 1 | 0 | 1 | 0 |
| Carrying Food | 0 | 0 | 0 | 0 | 0 | 0 | 0 | 0 | 0 | 0 | 0 | 0 |
| Copulating | 0 | 0 | 0 | 0 | 0 | 0 | 0 | 0 | 0 | 0 | 0 | 0 |
| Display | 0 | 0 | 0 | 0 | 0 | 0 | 0 | 0 | 0 | 0 | 0 | 0 |
| Dependent young | 0 | 0 | 0 | 0 | 0 | 0 | 0 | 1 | 0 | 1 | 0 | 0 |
| Faecal sac | 0 | 0 | 0 | 0 | 0 | 0 | 0 | 0 | 0 | 0 | 0 | 0 |
| Inspecting hollow | 0 | 0 | 0 | 0 | 0 | 0 | 0 | 0 | 0 | 0 | 0 | 0 |
| Nest building | 0 | 0 | 0 | 0 | 1 | 0 | 0 | 0 | 1 | 0 | 0 | 0 |
| Nest with eggs | 0 | 0 | 0 | 0 | 0 | 0 | 0 | 0 | 0 | 0 | 0 | 0 |
| Nest with young | 0 | 0 | 0 | 0 | 0 | 0 | 1 | 0 | 6 | 1 | 2 | 0 |
| On/leaving nest | 0 | 0 | 0 | 1 | 1 | 1 | 0 | 1 | 3 | 0 | 1 | 0 |
Breeding records by year
Average number of breeding records per period by breeding code| Period | Breeding (BLA code) | Carrying Food | Copulating | Display | Dependent young | Faecal sac | Inspecting hollow | Nest building | Nest with eggs | Nest with young | On/leaving nest |
|---|---|---|---|---|---|---|---|---|---|---|---|
| All years | |||||||||||
| All | 0.1 | 0.0 | 0.0 | 0.0 | 0.1 | 0.0 | 0.0 | 0.1 | 0.0 | 0.3 | 0.2 |
| Previous years | |||||||||||
| All previous years | 0.1 | 0.0 | 0.0 | 0.0 | 0.0 | 0.0 | 0.0 | 0.0 | 0.0 | 0.3 | 0.1 |
| Previous 30 years | 0.1 | 0.0 | 0.0 | 0.0 | 0.0 | 0.0 | 0.0 | 0.0 | 0.0 | 0.3 | 0.2 |
| Previous 20 years | 0.2 | 0.0 | 0.0 | 0.0 | 0.0 | 0.0 | 0.0 | 0.0 | 0.0 | 0.5 | 0.2 |
| 10 year groups | |||||||||||
| [2007,2017) | 0.3 | 0.0 | 0.0 | 0.0 | 0.1 | 0.0 | 0.0 | 0.1 | 0.0 | 0.6 | 0.4 |
| [1997,2007) | 0.1 | 0.0 | 0.0 | 0.0 | 0.0 | 0.0 | 0.0 | 0.0 | 0.0 | 0.3 | 0.0 |
| [1987,1997) | 0.0 | 0.0 | 0.0 | 0.0 | 0.0 | 0.0 | 0.0 | 0.0 | 0.0 | 0.0 | 0.1 |
| 5 year groups | |||||||||||
| [2012,2017) | 0.2 | 0.0 | 0.0 | 0.0 | 0.0 | 0.0 | 0.0 | 0.0 | 0.0 | 0.0 | 0.2 |
| [2007,2012) | 0.4 | 0.0 | 0.0 | 0.0 | 0.2 | 0.0 | 0.0 | 0.2 | 0.0 | 1.2 | 0.6 |
| [2002,2007) | 0.2 | 0.0 | 0.0 | 0.0 | 0.0 | 0.0 | 0.0 | 0.0 | 0.0 | 0.6 | 0.0 |
| [1997,2002) | 0.0 | 0.0 | 0.0 | 0.0 | 0.0 | 0.0 | 0.0 | 0.0 | 0.0 | 0.0 | 0.0 |
| [1992,1997) | 0.0 | 0.0 | 0.0 | 0.0 | 0.0 | 0.0 | 0.0 | 0.0 | 0.0 | 0.0 | 0.2 |
| [1987,1992) | 0.0 | 0.0 | 0.0 | 0.0 | 0.0 | 0.0 | 0.0 | 0.0 | 0.0 | 0.0 | 0.0 |
| Year | |||||||||||
| 2017 | 0.0 | 0.0 | 0.0 | 0.0 | 1.0 | 0.0 | 0.0 | 1.0 | 0.0 | 1.0 | 3.0 |
| 2016 | 0.0 | 0.0 | 0.0 | 0.0 | 0.0 | 0.0 | 0.0 | 0.0 | 0.0 | 0.0 | 1.0 |
| 2015 | 0.0 | 0.0 | 0.0 | 0.0 | 0.0 | 0.0 | 0.0 | 0.0 | 0.0 | 0.0 | 0.0 |
| 2014 | 0.0 | 0.0 | 0.0 | 0.0 | 0.0 | 0.0 | 0.0 | 0.0 | 0.0 | 0.0 | 0.0 |
| 2013 | 0.0 | 0.0 | 0.0 | 0.0 | 0.0 | 0.0 | 0.0 | 0.0 | 0.0 | 0.0 | 0.0 |
| 2012 | 1.0 | 0.0 | 0.0 | 0.0 | 0.0 | 0.0 | 0.0 | 0.0 | 0.0 | 0.0 | 0.0 |
| 2011 | 0.0 | 0.0 | 0.0 | 0.0 | 0.0 | 0.0 | 0.0 | 0.0 | 0.0 | 1.0 | 0.0 |
| 2010 | 0.0 | 0.0 | 0.0 | 0.0 | 0.0 | 0.0 | 0.0 | 0.0 | 0.0 | 1.0 | 1.0 |
| 2009 | 2.0 | 0.0 | 0.0 | 0.0 | 0.0 | 0.0 | 0.0 | 0.0 | 0.0 | 0.0 | 2.0 |
| 2008 | 0.0 | 0.0 | 0.0 | 0.0 | 0.0 | 0.0 | 0.0 | 0.0 | 0.0 | 3.0 | 0.0 |
| 2007 | 0.0 | 0.0 | 0.0 | 0.0 | 1.0 | 0.0 | 0.0 | 1.0 | 0.0 | 1.0 | 0.0 |
| 2006 | 1.0 | 0.0 | 0.0 | 0.0 | 0.0 | 0.0 | 0.0 | 0.0 | 0.0 | 1.0 | 0.0 |
| 2005 | 0.0 | 0.0 | 0.0 | 0.0 | 0.0 | 0.0 | 0.0 | 0.0 | 0.0 | 0.0 | 0.0 |
| 2004 | 0.0 | 0.0 | 0.0 | 0.0 | 0.0 | 0.0 | 0.0 | 0.0 | 0.0 | 2.0 | 0.0 |
| 2003 | 0.0 | 0.0 | 0.0 | 0.0 | 0.0 | 0.0 | 0.0 | 0.0 | 0.0 | 0.0 | 0.0 |
| 2002 | 0.0 | 0.0 | 0.0 | 0.0 | 0.0 | 0.0 | 0.0 | 0.0 | 0.0 | 0.0 | 0.0 |
| 2001 | 0.0 | 0.0 | 0.0 | 0.0 | 0.0 | 0.0 | 0.0 | 0.0 | 0.0 | 0.0 | 0.0 |
| 2000 | 0.0 | 0.0 | 0.0 | 0.0 | 0.0 | 0.0 | 0.0 | 0.0 | 0.0 | 0.0 | 0.0 |
| 1999 | 0.0 | 0.0 | 0.0 | 0.0 | 0.0 | 0.0 | 0.0 | 0.0 | 0.0 | 0.0 | 0.0 |
| 1998 | 0.0 | 0.0 | 0.0 | 0.0 | 0.0 | 0.0 | 0.0 | 0.0 | 0.0 | 0.0 | 0.0 |
| 1997 | 0.0 | 0.0 | 0.0 | 0.0 | 0.0 | 0.0 | 0.0 | 0.0 | 0.0 | 0.0 | 0.0 |
| 1996 | 0.0 | 0.0 | 0.0 | 0.0 | 0.0 | 0.0 | 0.0 | 0.0 | 0.0 | 0.0 | 1.0 |
| 1995 | 0.0 | 0.0 | 0.0 | 0.0 | 0.0 | 0.0 | 0.0 | 0.0 | 0.0 | 0.0 | 0.0 |
| 1994 | 0.0 | 0.0 | 0.0 | 0.0 | 0.0 | 0.0 | 0.0 | 0.0 | 0.0 | 0.0 | 0.0 |
| 1993 | 0.0 | 0.0 | 0.0 | 0.0 | 0.0 | 0.0 | 0.0 | 0.0 | 0.0 | 0.0 | 0.0 |
| 1992 | 0.0 | 0.0 | 0.0 | 0.0 | 0.0 | 0.0 | 0.0 | 0.0 | 0.0 | 0.0 | 0.0 |
| 1991 | 0.0 | 0.0 | 0.0 | 0.0 | 0.0 | 0.0 | 0.0 | 0.0 | 0.0 | 0.0 | 0.0 |
| 1990 | 0.0 | 0.0 | 0.0 | 0.0 | 0.0 | 0.0 | 0.0 | 0.0 | 0.0 | 0.0 | 0.0 |
| 1989 | 0.0 | 0.0 | 0.0 | 0.0 | 0.0 | 0.0 | 0.0 | 0.0 | 0.0 | 0.0 | 0.0 |
| 1988 | 0.0 | 0.0 | 0.0 | 0.0 | 0.0 | 0.0 | 0.0 | 0.0 | 0.0 | 0.0 | 0.0 |
| 1987 | 0.0 | 0.0 | 0.0 | 0.0 | 0.0 | 0.0 | 0.0 | 0.0 | 0.0 | 0.0 | 0.0 |
| 1986 | 0.0 | 0.0 | 0.0 | 0.0 | 0.0 | 0.0 | 0.0 | 0.0 | 0.0 | 0.0 | 0.0 |
| 1985 | 0.0 | 0.0 | 0.0 | 0.0 | 0.0 | 0.0 | 0.0 | 0.0 | 0.0 | 0.0 | 0.0 |
| 1984 | 0.0 | 0.0 | 0.0 | 0.0 | 0.0 | 0.0 | 0.0 | 0.0 | 0.0 | 0.0 | 0.0 |
| 1983 | 0.0 | 0.0 | 0.0 | 0.0 | 0.0 | 0.0 | 0.0 | 0.0 | 0.0 | 0.0 | 0.0 |
| 1982 | 0.0 | 0.0 | 0.0 | 0.0 | 0.0 | 0.0 | 0.0 | 0.0 | 0.0 | 0.0 | 0.0 |
Distribution map
Distribution - 2017
This map shows the observed distribution of the Great Cormorant for 2017.
The red circles are the grid cells where Great Cormorant have been reported.
The transparency of the red circles indicate how many surveys sheets were submitted for that grid cell; the darker the red the more reliable the data. Of the 315 grid cells with reports, 83 had only one sheet; an example is grid number A11.
The size of the circle represents the reporting rate. The maximum reporting rate for Great Cormorant was 20.0% (eg grid number F10) and the minimum was 0.3% (eg grid number Z1). 
Distribution - all years
This map shows the observed distribution of the Great Cormorant for all years.
The red circles are the grid cells where Great Cormorant have been reported.
The transparency of the red circles indicate how many surveys sheets were submitted for that grid cell; the darker the red the more reliable the data. Of the 703 grid cells with reports, 55 had only one sheet; an example is grid number B5.
The size of the circle represents the reporting rate. The maximum reporting rate for Great Cormorant was 100.0% (eg grid number B5) and the minimum was 0.1% (eg grid number L15). 
Breeding map
Breeding - 2017
This map shows the breeding distribution of the Great Cormorant for 2017.
The red circles are the grid cells where breeding activity for Great Cormorant have been reported.
The size of the circle represents the number of reports. 
Breeding - all years
This map shows the breeding distribution of the Great Cormorant for all years.
The red circles are the grid cells where breeding activity for Great Cormorant have been reported.
The size of the circle represents the number of reports. 